Compared to photos, video posts get 135% more reach. In particular, native videos do even better. Facebook video is one of the most useful tools companies have in their toolkit. An important aspect of the video capabilities is the detailed analytics they provide. But, sometimes the data provided can be difficult to interpret. Video metrics can be broken down into two major categories: engagement and retention. By understanding the metrics Facebook videos provide, your small business can utilize videos more effectively.
Video Engagement
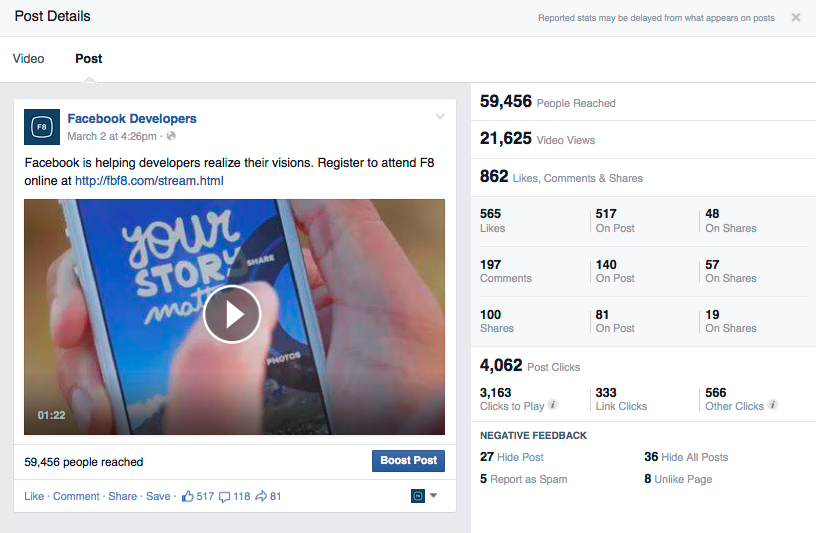
Engagement metrics give you the best view of how much your video resonated with your audience. Video engagement has a few metrics that are key to understanding your video’s performance. The basic metrics are likes, comments, and shares on your video post as well as negative feedback metrics. Likes, comments, and shares generally all mean that your post resonated well with viewers. Negative feedback includes when viewers hide the specific post, hide all of your pages posts, video reported as spam, and when someone “unlikes” your page.
What do you measure?
When a video post has a high feedback rate, figure out why it resonated with your audience and replicate it! When it has a low feedback rate, take note of why it alienated viewers and do not repeat your mistake. Another way to measure the success of your post is by comparing it to previous video posts using the engagement rate metric. Engagement rate is the total engagement (all clicks, likes, comments, and shares) divided by the total reach (the number of unique viewers).
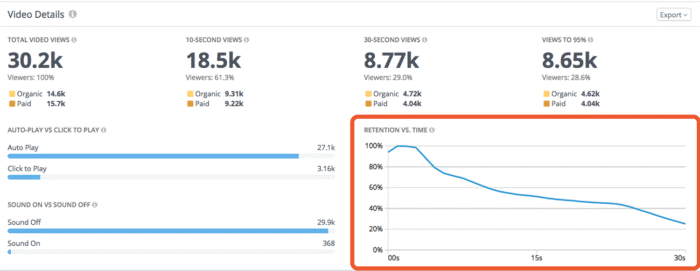
Retention metrics are more specific to video posts. In general, they detail how viewers engaged with your post. Two key metrics are 10-second views and 30-second views. 10-second views is the number of viewers who watch your video to at least 10 seconds or finish the video if it is shorter than 10 seconds. 30-second views is the number of viewers who watch your video for at least 30-seconds or to the end if your video is shorter than 30 seconds. Using this data, you can understand what the views actually were sustained for the full length of video.
Retention vs. Time
Another important aspect of Facebook video metrics is the retention vs. time graph. This graph shows you how many people are viewing your video at every second of its duration. Most graphs start off with a high number of viewers, then dwindle as the video approaches its end. Though that may be intuitive, it offers some great insights. When you look at the graph, there will be points where you lose more viewers than at other points. Take a look at that time in your video to see what made more people leave. This graph can help you pinpoint exactly what made people dislike your video and leave.
Understanding how both engagement and retention metrics describe your video is essential to developing great video content. By using insights from engagement data, your business is better able to understand how well your content resonated with its viewers. Retention data describes in detail how viewers interacted with your video and for how long. Applying these insights to each and every post will help your business better utilize the powerful tool of Facebook video.